Summary
A profit and loss statement tells you whether your business model actually works, not just whether money is coming in. Most small business owners read only the top line (revenue) or the bottom line (net income) and miss the two numbers that matter most: gross margin and operating income. This guide walks through every section of a P&L in plain language, with benchmarks, a worked example, and a framework for monthly analysis.
- Gross profit is the most diagnostic number on your P&L.
It tells you whether your core activity is economically viable before overhead enters the picture. - Net income is not cash.
A profitable business can still run out of money if receivables are slow, growth is rapid, or loan repayments are consuming cash that never shows up as an expense. - Gross margin benchmarks vary widely by industry:
Software companies typically run 70-85%, restaurants 60-70% on food cost, and construction 15-30%. Know your sector before judging your own numbers. - Monthly P&L review is the minimum standard.
Annual review means eleven months of blind spots. Most accounting software generates the report in seconds. - Comparing periods matters more than reading a single statement.
A declining gross margin over three quarters tells you something a single month never can.
Your accountant sends you a profit and loss statement. You open it, see rows of numbers, and close it. Sound familiar?
Most small business owners know their P&L exists and that they're supposed to care about it. Far fewer know how to actually read one, which line tells you whether your business model works, which number reveals whether you can afford to hire, or what a healthy gross margin looks like in their industry.
This guide changes that. By the end, you'll be able to open any profit and loss statement, understand what every section is telling you, and use it to make better decisions about your business. No accounting degree required.
What Is a Profit & Loss Statement?
A profit and loss statement, also called an income statement or P&L, is one of the three core financial statements every business produces. It summarizes your revenue, costs, and expenses over a specific period (a month, a quarter, or a year) and shows whether the business made money or lost it during that time.
The other two core financial statements are the balance sheet (a snapshot of what you own and owe at a point in time) and the cash flow statement (how cash actually moved in and out of the business). The P&L sits between them, it tells the story of business performance over a period, while the balance sheet captures the result.
The Securities and Exchange Commission (SEC) describes the income statement as showing "how much money a company earned and spent over a period of time." For small business owners, it answers one essential question: did we actually make money doing what we do?
Before You Start: Accrual vs. Cash Basis
This distinction matters before you read a single number on your P&L.
On an accrual-basis P&L, revenue is recognized when earned: when you deliver the service or ship the product, regardless of when the customer pays. On a cash-basis P&L, revenue is recognized when the cash arrives.
If your business carries significant receivables or takes advance payments, the same month of activity can produce dramatically different P&L results depending on which method your accountant uses. Always confirm your accounting basis before comparing periods or benchmarking against industry data.
Why the P&L Is the Most Important Financial Statement for Most Business Owners
The balance sheet tells you where you stand. The cash flow statement tells you whether you can pay your bills. The P&L tells you whether your business model works.
Specifically, the P&L answers:
- Are we generating enough revenue relative to what it costs to deliver our product or service?
- What percentage of revenue survives after we pay our operating costs?
- Are our expenses growing faster than our revenue?
- Are we actually profitable, or just busy?
That last question is the one that catches most small business owners off guard. High revenue does not mean profitable. A business doing $800,000 in revenue with $820,000 in expenses is losing $20,000 a year, and without a P&L, the owner may not know it until their bank account is empty.
As noted in Harvard Business School's financial accounting primer, "the income statement is a scorecard of how well the company is performing." It's the document your banker reviews when you apply for a loan, what investors scrutinize before writing a check, and what your accountant uses to minimize your tax bill.
The Structure of a Profit & Loss Statement
Every P&L follows the same top-to-bottom logic, regardless of industry or business size. Revenue at the top, costs and expenses flowing down, profit (or loss) at the bottom. Here's how each section works:
1. Revenue (also called Sales or Turnover)
Revenue is the total amount your business earned from its primary activities during the period before any costs are deducted. If you sell products, it's gross sales. If you sell services, it's fees billed. If you do both, it's combined.
Gross revenue is the raw total before any returns or discounts. Net revenue (sometimes called net sales) subtracts returns, refunds, and allowances from gross revenue. For most small businesses, the revenue line at the top of the P&L is net revenue.
What to look for: Is revenue growing period over period? Is it concentrated in one client or product (concentration risk)? Does it match what you expected based on your sales activity?
A note on accrual vs cash basis: On an accrual-basis P&L, revenue is recognized when earned when you deliver the service or ship the product regardless of when the customer pays. On a cash-basis P&L, revenue is recognized when the cash arrives. This distinction matters enormously for businesses with significant receivables or advance payments. The IRS Publication 538 covers the accounting method rules in detail.
2. Cost of Goods Sold (COGS)
COGS represents the direct costs of producing whatever you sold the materials, labor, and production costs that exist specifically because you made and sold that product or service. If you didn't sell anything, you wouldn't have these costs.
For a product business: raw materials, manufacturing labor, packaging, shipping to the customer.
For a service business: the direct labor cost of delivering the service (the consultant's billable hours, the contractor's labor on the job).
For a software business: hosting costs, third-party API fees, customer support costs directly tied to delivering the product.
What COGS is not: COGS does not include your office rent, your marketing spend, your accountant's fees, or your executive salaries. Those are operating expenses and appear further down the statement.
3. Gross Profit and Gross Margin
Gross profit = Revenue − COGS
This is the money left after you've paid the direct cost of delivering your product or service before overhead. Gross profit is arguably the most important single number on the P&L because it tells you whether your core business activity is economically viable.
Gross margin expresses gross profit as a percentage of revenue:
Gross margin % = (Gross Profit ÷ Revenue) × 100
A business with $500,000 in revenue, $300,000 in COGS, and $200,000 in gross profit has a 40% gross margin.
What's a healthy gross margin? It varies dramatically by industry. According to NYU Stern's industry margin data:
If your gross margin is significantly below your industry benchmark, your pricing is too low, your direct costs are too high, or both.
4. Operating Expenses
Operating expenses (also called OpEx or selling, general and administrative expenses, SG&A) are the costs of running the business that aren't directly tied to producing your product or service. These exist whether you sold a lot or a little.
Common operating expense categories:
- Payroll and benefits (for non-production staff)
- Rent and utilities
- Marketing and advertising
- Software subscriptions
- Insurance
- Legal and professional fees
- Depreciation and amortization
- Office supplies and equipment
Operating expenses are where most of the day-to-day business spending lives, and where most of the controllable cost management happens. Unlike COGS (which scales directly with revenue), many operating expenses are relatively fixed in the short term, which is why increasing revenue without proportionally increasing OpEx is the primary lever for improving profitability.
5. Operating Income (EBIT)
Operating income = Gross Profit − Operating Expenses
This is also called EBIT, Earnings Before Interest and Taxes, and it's the profit your business generates purely from its operations, before financing costs (interest on debt) and taxes.
Operating income is the number that tells you whether the business itself is profitable, stripped of capital structure decisions and tax strategy. Two identical businesses with different amounts of debt will have different net incomes but the same operating income if their operations are equally efficient.
Net operating income (NOI) is essentially the same concept, used most commonly in real estate and some other asset-heavy industries. Investopedia's definition of net operating income describes it as "a company's total income after operating expenses are deducted."
The operating margin, operating income divided by revenue, is one of the most widely used benchmarks for business health and is what most investors and lenders focus on when evaluating a business.
6. Other Income and Expenses
Below the operating income line, the P&L captures financial activity that isn't part of core operations:
- Interest income (money earned on cash balances)
- Interest expense (cost of debt, loans, credit lines)
- Gain or loss on sale of assets
- Other non-operating income or expenses
For most small businesses, this section is relatively small. The main item to watch is interest expense, if your debt service is consuming a significant portion of your operating income, that's a financial structure concern worth addressing.
7. Net Income Before Tax
Net income before tax = Operating Income + Other Income − Other Expenses
This is your total profit before the tax provision. For small businesses that run on a cash basis or use tax planning strategies, this number may differ significantly from your taxable income — depreciation, timing differences, and deductible expenses all create gaps between book profit and taxable profit.
8. Tax Provision
For C corporations, income tax appears as an expense on the P&L. For pass-through entities (sole proprietors, partnerships, S corporations, LLCs), business income flows through to the owners' personal returns, so you may not see a tax line on the business P&L itself. This is one reason why comparing P&Ls across different business structures requires care.
9. Net Income (The Bottom Line)
Net income = Net Income Before Tax - Taxes
This is what the business earned (or lost) after every cost and expense. Positive net income means the business was profitable. Negative net income means it was not.
Net income is not the same as cash in your bank account.
A profitable business can still run out of cash if customers are slow to pay, if capital purchases are not reflected on the P&L, or if loan principal repayments are draining the account. This is why the cash flow statement exists alongside the P&L.
P&L Red Flags to Watch For
Reading the numbers is one thing. Knowing which patterns signal a problem before it becomes a cash crisis is another. These are the warning signs worth building into your monthly review.
- Gross margin declining for two or more consecutive quarters.
This almost always means either pricing has eroded, direct costs have increased, or the business mix has shifted toward lower-margin work. Left unaddressed, this will compress net income even if revenue is growing. - Operating expenses above 60% of revenue.
In most service and product businesses, operating expenses consistently above this threshold indicate overhead is outpacing growth. Identify which categories are rising as a percentage of revenue, not just in absolute dollars. - Interest expense above 10% of operating income.
At this level, debt service is materially affecting profitability. This does not mean the debt is bad, but it does mean the cost of capital is a factor that needs active management. - Revenue growth with flat or declining gross profit in absolute terms.
If you are selling more but keeping less per sale, you are growing in a way that is costing you. This pattern often emerges when discounting, higher-cost input prices, or scope creep are not yet visible in the top line. - Net income positive but operating cash flow consistently negative.
This is not visible on the P&L alone, but the combination of a healthy P&L and a struggling bank account is the classic indicator of a receivables problem or rapid inventory build.
How to Analyze a P&L: What to Actually Look For
Reading the numbers is step one. Analyzing them is where the value lives.
Compare periods, not just absolutes
A single P&L tells you how the business performed in one period. Comparing two or three periods, month over month or year over year, tells you whether performance is improving or declining and at what rate. Most accounting software lets you run comparative P&Ls side by side. Use this feature.
Calculate your key margins
Three ratios turn your P&L into actionable intelligence:
Gross margin % = Gross Profit ÷ Revenue
Operating margin % = Operating Income ÷ Revenue
Net margin % = Net Income ÷ Revenue
Track these monthly. A declining gross margin usually signals a pricing or cost problem. A declining operating margin despite stable gross margin signals overhead growing faster than revenue. A widening gap between operating margin and net margin signals growing debt costs.
Look for expense creep
Operating expenses have a tendency to grow quietly, another software subscription here, an extra contractor there, without being consciously approved. A monthly P&L review that compares expenses as a percentage of revenue (rather than just absolute dollars) reveals expense creep before it becomes a profitability problem.
Check whether revenue growth is actually profitable
This sounds obvious, but it's frequently missed. If revenue grew 20% but COGS grew 30%, your gross margin compressed, the growth is costing you more than it's returning. Real revenue growth improves gross profit in absolute terms and maintains or improves gross margin percentage.
Benchmark against your industry
Raw numbers only mean something in context. Your 18% net margin might be exceptional in one industry and below average in another. Resources like NYU Stern's industry data and IBISWorld industry reports provide benchmarks by sector that let you evaluate your performance against comparable businesses.
Use these ranges as reference points, not firm targets. Margins within any industry vary by business model, geographic market, and scale. Data sourced from NYU Stern industry analysis.
If your gross margin is significantly below your industry benchmark, your pricing may be too low, your direct costs too high, or both. Margin analysis is only meaningful if you know which category your business falls into.
How a P&L Connects to Your Tax Return
The relationship between your P&L and your tax liability depends heavily on your business structure.
For C corporations, the P&L is the direct input to the corporate tax return. Net income before tax on the P&L corresponds closely to taxable income, adjusted for deductions and timing differences.
For pass-through entities (sole proprietors, single-member LLCs, S corporations, partnerships), business income does not get taxed at the entity level. It flows to the owner's personal return. This means the P&L will not show a tax line, and comparing your profitability to a C corp P&L requires adjusting for this structural difference.
Depreciation is the most common gap between book profit and taxable profit. Your P&L uses straight-line depreciation over an asset's useful life. Your tax return may use accelerated methods, creating a temporary difference. Your accountant manages this gap through the tax provision, but it is worth understanding when your P&L net income and your tax bill do not line up the way you expect.
Common Mistakes When Reading a P&L
- Confusing revenue with profit
Revenue is the top line. Profit is the bottom line. A business doing $2 million in revenue with $2.1 million in expenses is not a $2 million business, it's a business losing $100,000 a year. Always read the full statement, not just the top line. - Ignoring the gross margin line
Many business owners skip straight to net income. Gross margin is actually more diagnostic, it tells you whether the fundamental business model works before overhead enters the picture. A great net income built on a thin gross margin is fragile. A great gross margin with a weak net income points to a controllable overhead problem. - Treating net income as available cash
Profitable businesses fail because their owners withdraw net income as if it's cash, without accounting for upcoming tax bills, loan repayments, or capital expenditures. Net income is an accounting concept. Cash in your operating account is a reality. Know the difference. LayerNext's AI CFO insights flag exactly these gaps in real time. - Only looking at it annually
A year-end P&L tells you what happened. A monthly P&L lets you see problems developing in time to do something about them. If you're only reviewing your P&L once a year, you're flying blind for eleven months.
A Simple P&L Example: What a Healthy Statement Looks Like
Here's what a basic P&L looks like for a small service business:
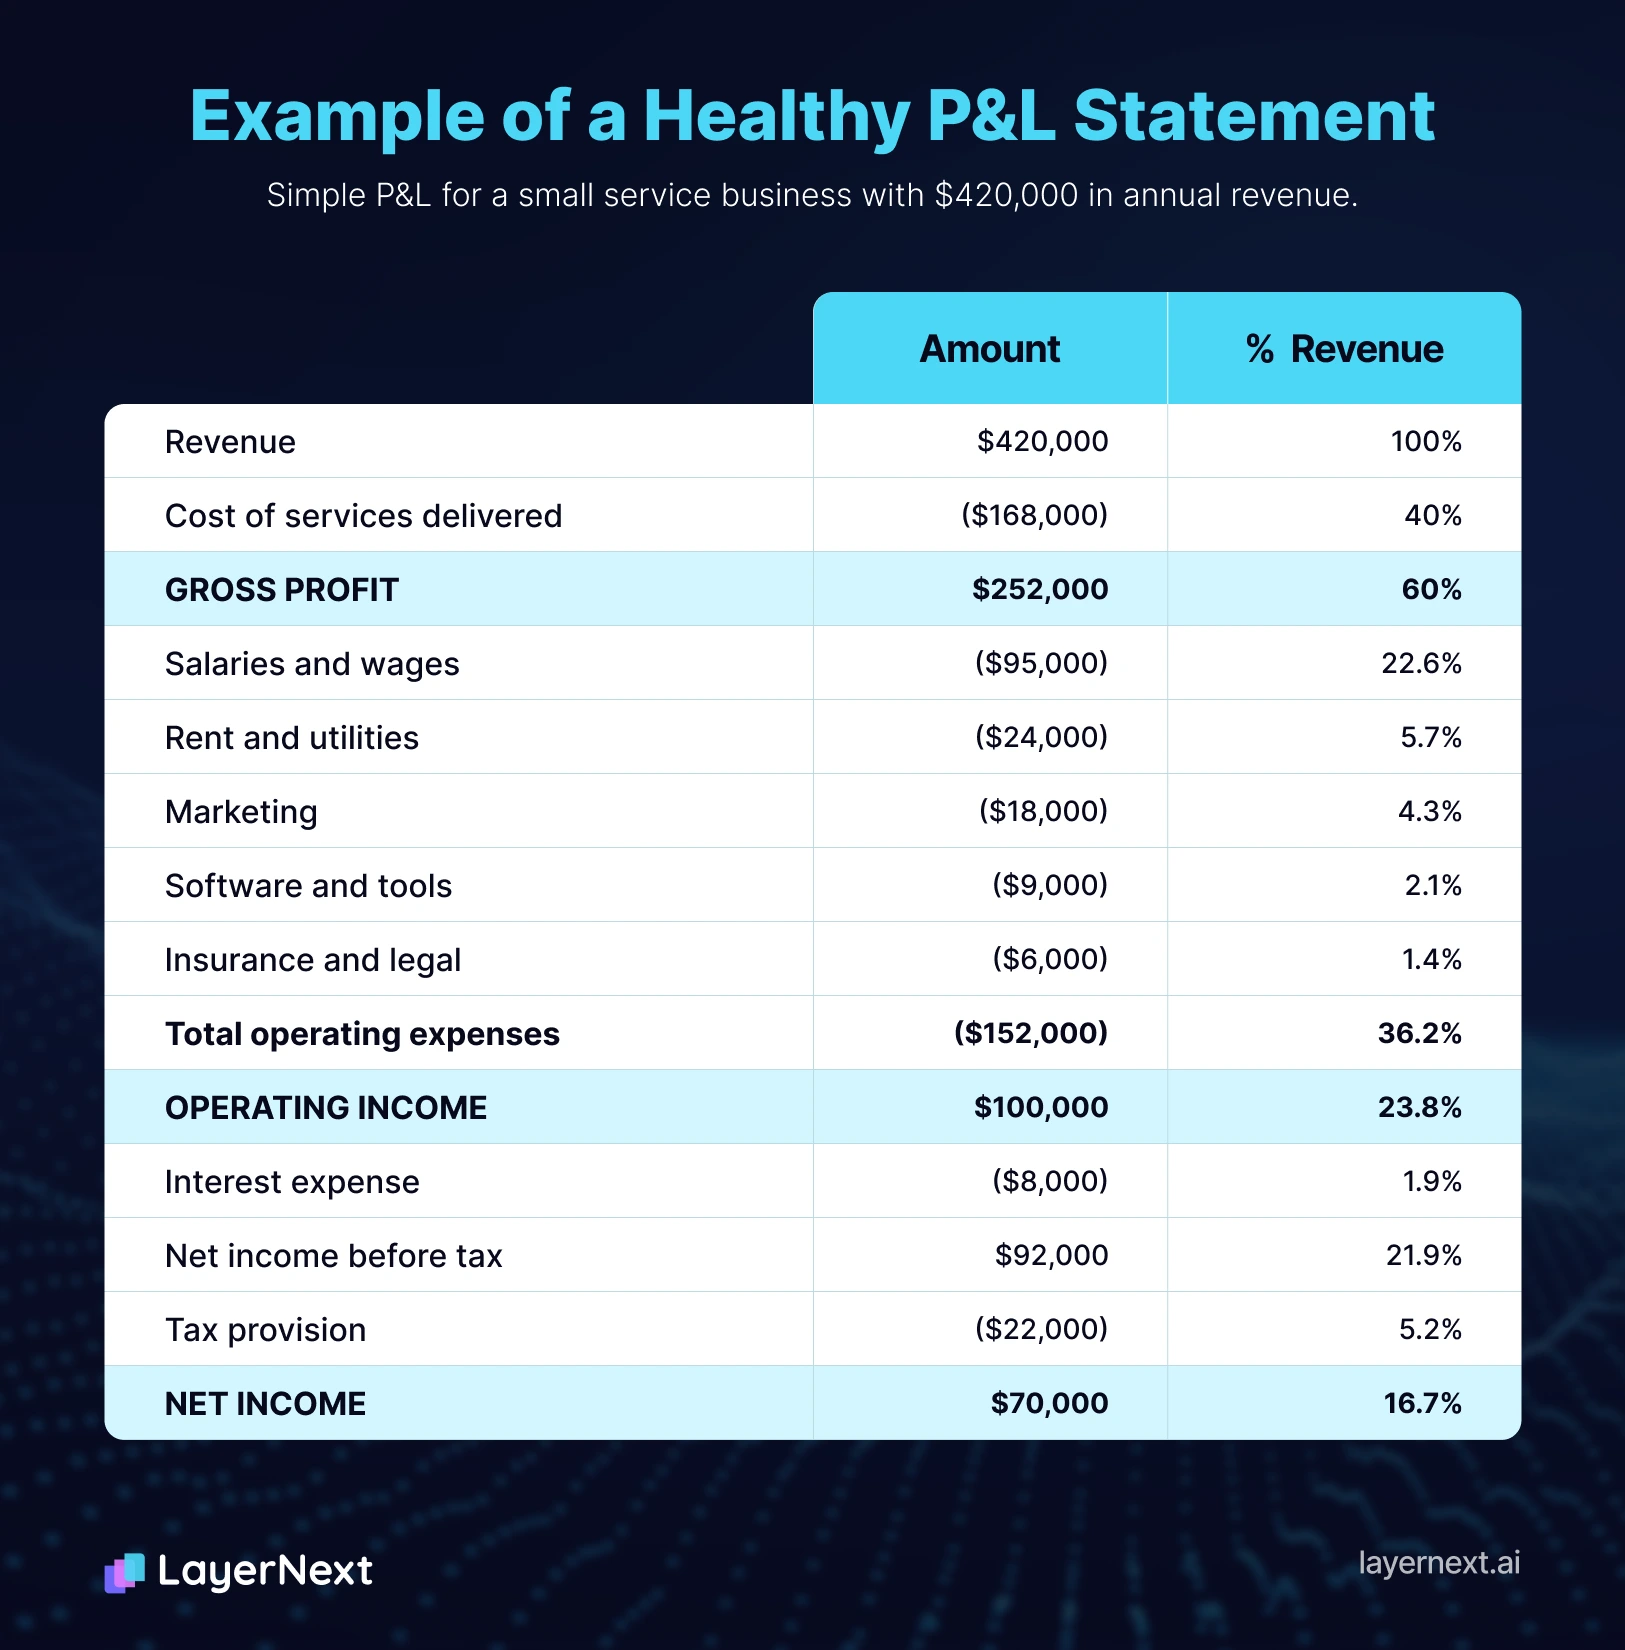
This business has a healthy 60% gross margin, indicating its service delivery model is efficient. Operating expenses are well-controlled at 36% of revenue, producing a strong 23.8% operating margin. Net margin of 16.7% is solid for a service business.
Frequently Asked Questions
Start Reading Your P&L Like a CFO
Understanding your profit and loss statement is the single highest-leverage financial skill a business owner can develop. It takes the mystery out of your finances and puts you in control of your pricing, your cost structure, your growth decisions, and your tax planning.
The prerequisite is having a P&L that's accurate and current. A P&L built on miscategorized transactions or a two-month-old reconciliation tells you a story that may have nothing to do with reality.
LayerNext keeps your books continuously reconciled and always closed, so your P&L reflects your actual business performance at any moment, not just on the day your bookkeeper gets around to it.