


Running a small business without a clear financial picture is like driving without headlights. LayerNext's AI CFO Financial Intelligence Report gives you everything a full-time CFO would deliver, sent automatically on a weekly, monthly, quarterly, or yearly schedule.
What Is LayerNext? Your AI CFO for Small Business
If you've ever missed a month-end close, had your accountant asking where the receipts went, or stayed up late trying to reconcile QuickBooks, you'll understand why LayerNext was built.
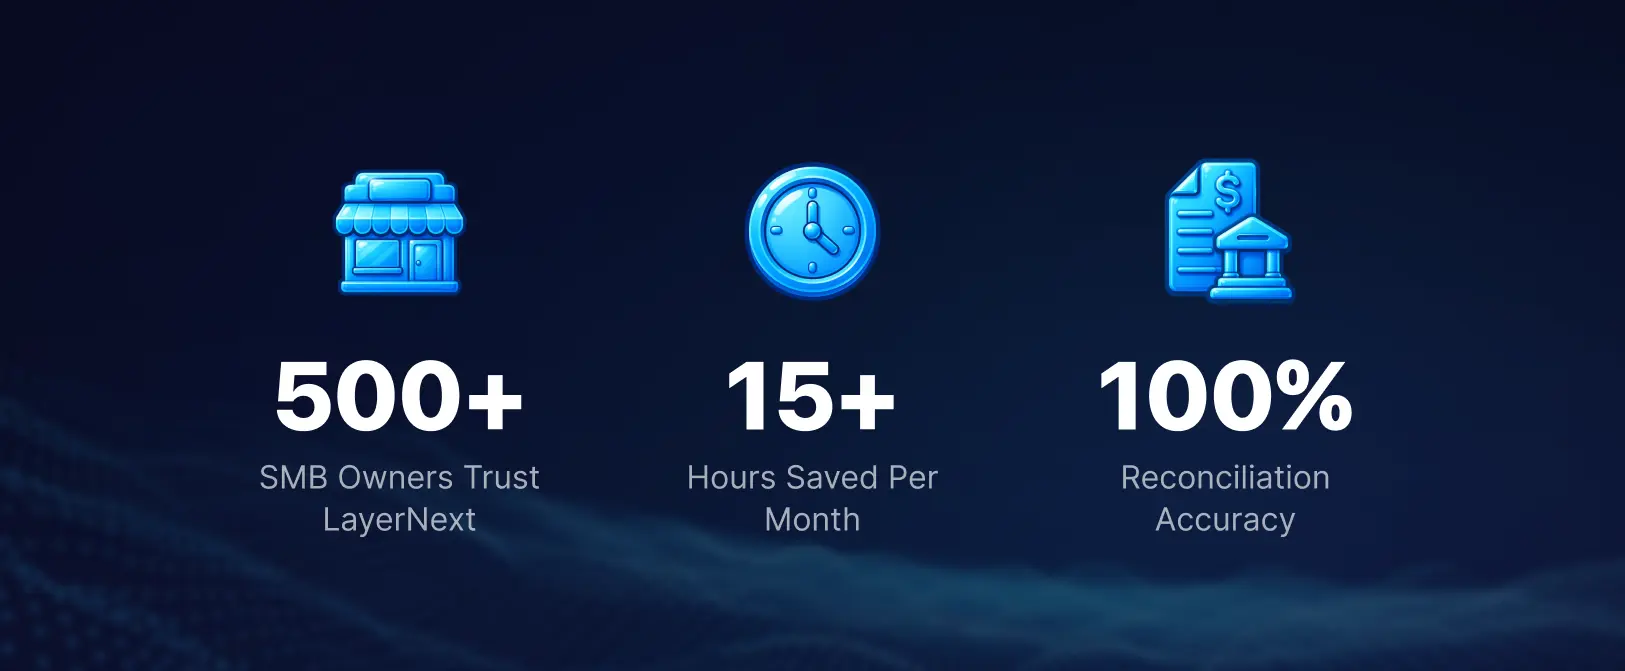
LayerNext is an AI-powered CFO platform designed for small and medium-sized businesses. Trusted by 500+ SMB owners, it automates the three most painful parts of running a business's finances: bookkeeping, bank reconciliation, and financial reporting.
Unlike traditional bookkeeping software that assists you, LayerNext operates as a fully autonomous AI agent. It processes your invoices and receipts, reconciles your bank feeds, and keeps your books closed without you touching a spreadsheet. It integrates directly with QuickBooks. Xero and Sage support is on the way.
What Makes It Different From Bookkeeping Software
Most bookkeeping software is AI-assisted: it helps you do the work. LayerNext is fully autonomous. It does not suggest categories; it applies them. It does not flag reconciliation gaps for you to fix; it fixes them. The platform's flagship output is the CFO Financial Intelligence Report: a detailed, data-rich analysis of your business's financial health, generated automatically.
What a Small Business Financial Report Should Cover
Most small business owners receive either a basic income statement from their accountant or a raw QuickBooks export. Neither is a financial report. A genuine small business financial report answers six questions that determine whether the business is healthy:
- Where is revenue coming from, and is it growing consistently?
- Which customers represent the most risk if they leave?
- Where are expenses growing faster than revenue?
- What does the full-year profit and loss projection show?
- Is the underlying financial data clean and audit-ready?
- What should the owner actually do differently, based on the numbers?
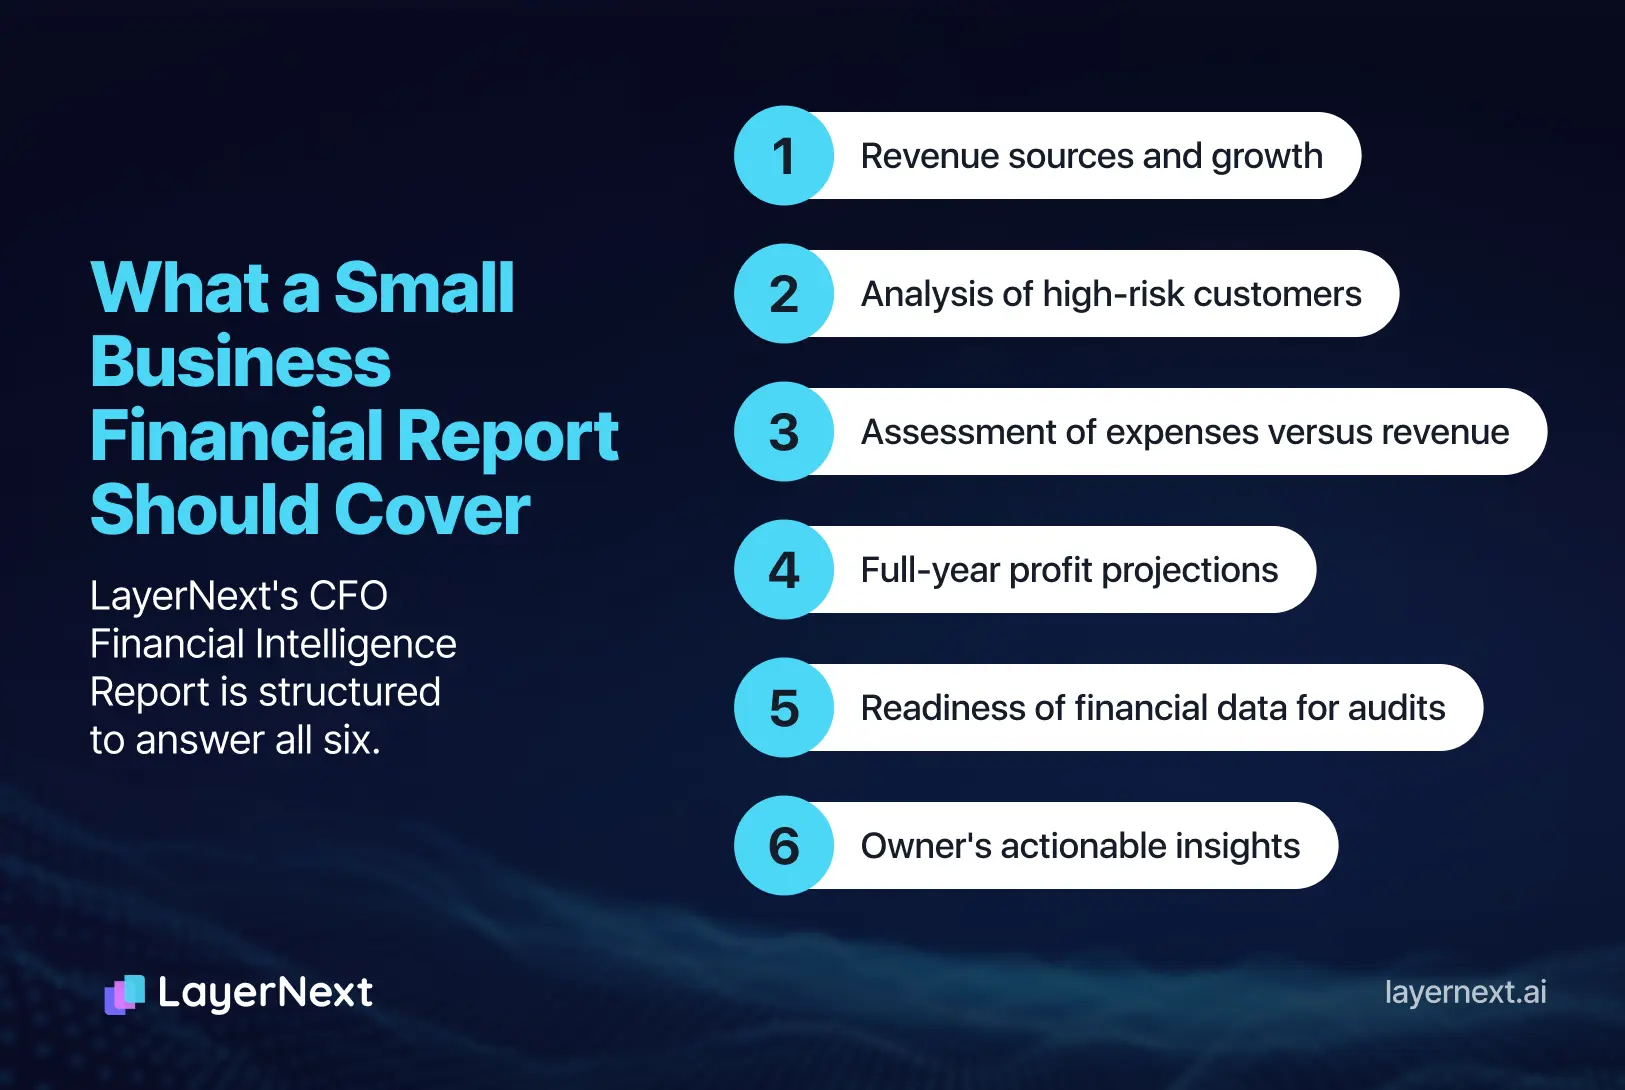
LayerNext's CFO Financial Intelligence Report is structured to answer all six. The sections below walk through each one using a sample report generated for BondvilleNorth Infrastructure Group.
How AI Automates Small Business Financial Reporting
The traditional small business reporting workflow looks like this: at month-end, a bookkeeper exports QuickBooks data to Excel, manually builds a pivot table, formats a PDF, and emails it two to three weeks after the period closes. By the time the report arrives, the numbers are stale and the decisions have already been made.
LayerNext eliminates that cycle. Because the platform reconciles transactions in real time, every report reflects today's actual numbers. There is no export. No formatting. No waiting. The report is generated and sent on a schedule you set, and it covers the same ground a full-time CFO would in a quarterly review.
What Gets Automated
- Transaction categorization
Every bank transaction and invoice is categorized automatically against your chart of accounts. No uncoded items, no cleanup at month-end. - Bank reconciliation
LayerNext reconciles your bank feeds continuously, so the numbers in the report match the numbers in your bank account. - Report generation
The CFO report compiles revenue analysis, P&L projections, expense breakdowns, customer concentration data, and data integrity checks, then delivers it to your inbox on schedule. - Anomaly detection
Duplicate charges, unusual spend spikes, and reconciliation gaps are flagged automatically before they appear in a report that matters.
Introducing the CFO Financial Intelligence Report
The CFO Financial Intelligence Report is LayerNext's flagship deliverable: a detailed, data-rich analysis of your business's financial health. It covers everything from revenue trends and customer concentration to expense categorisation, profitability projections, and data integrity checks.
The report is designed to flex with your business rhythm. LayerNext sends it to you automatically on your chosen schedule:
- Weekly
Perfect for high-velocity businesses that need a pulse on cash flow every week. - Monthly
Ideal for fast-moving businesses that need tight cash flow visibility. - Quarterly
Perfect for strategic reviews and comparing performance across periods. - Yearly
The executive overview for annual planning, investor updates, or tax prep.
Here's a look at the report structure, using a sample example generated for BondvilleNorth Infrastructure Group:
Each section of the report is designed to answer a specific question your business should be asking, and most small business owners never get around to asking, because pulling the data takes too long. LayerNext solves that permanently.
Revenue Analysis: Know Exactly Where Your Money Comes From
The report's revenue section is broken into three layers: monthly revenue trends, quarterly comparisons, and a forward forecast. This gives business owners a 360-degree view of sales performance, past, present, and projected.
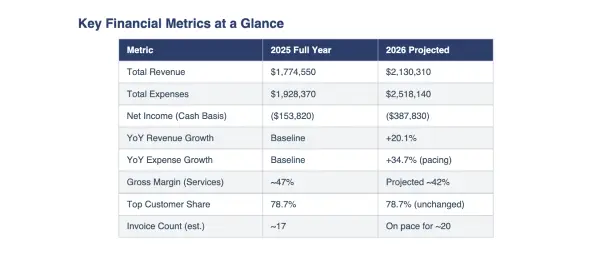
For BondvilleNorth, the monthly revenue chart covering 2025 actuals and 2026 YTD vs. forecast revealed strong peaks in June ($195K) and September ($205K). The 2026 forecast applies a 20.1% year-over-year growth factor, projecting full-year revenue of approximately $2.13M. Without this visualisation, those patterns and projections would have been invisible in a raw QuickBooks export.
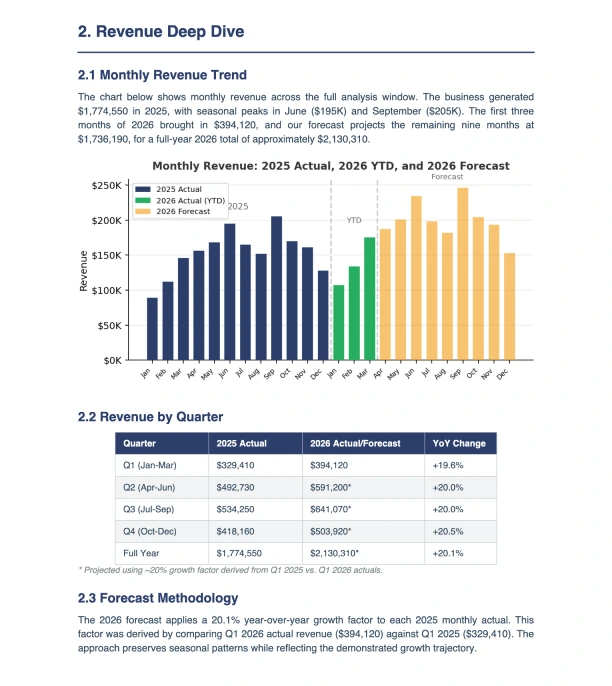
Revenue by Quarter
The quarterly breakdown compares Q1-Q4 2025 performance side by side, making it effortless to identify which quarters consistently underperform and why. For teams doing budget planning, this section alone replaces hours of spreadsheet work.
.webp)
Customer Revenue Analysis & Concentration Risk
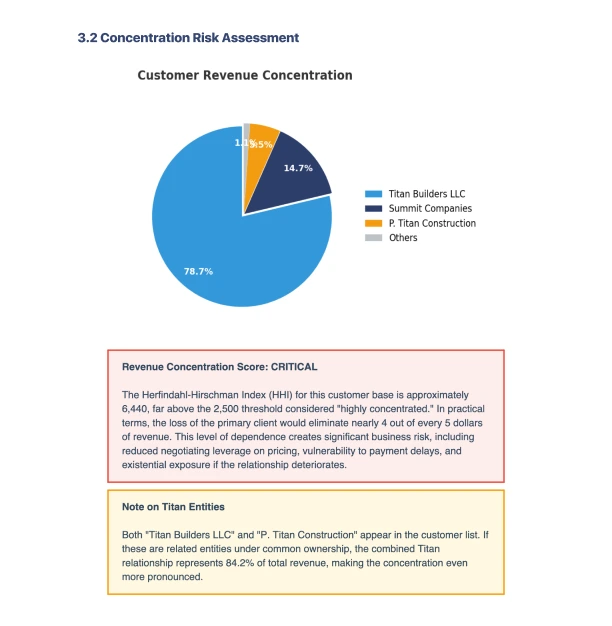
One of the most underrated sections in the report is customer revenue concentration. For many SMBs, a handful of clients represent the majority of income, which is both a strength and a vulnerability.
LayerNext calculates each customer's percentage of total revenue and presents it as a concentration breakdown. If one client represents over 40% of your revenue and churns, you have a crisis. This section makes that risk visible before it becomes one.
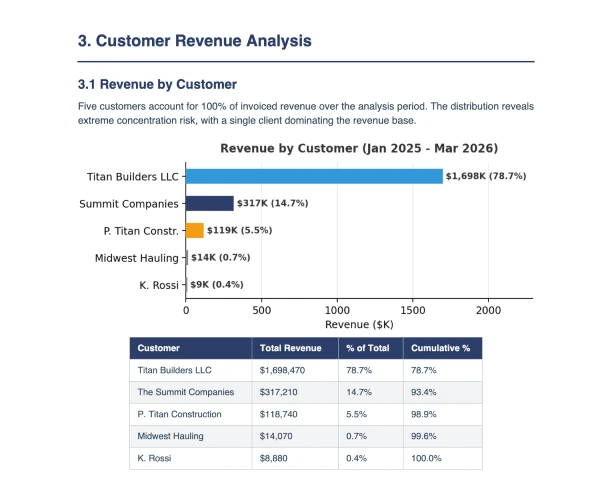
For bookkeeping purposes, this view also confirms which customers drive the most accounts receivable, helping you prioritise collections and follow-ups. Clean, current data on your biggest clients is foundational to cash flow management.
Expense Intelligence: Stop the Invisible Leaks
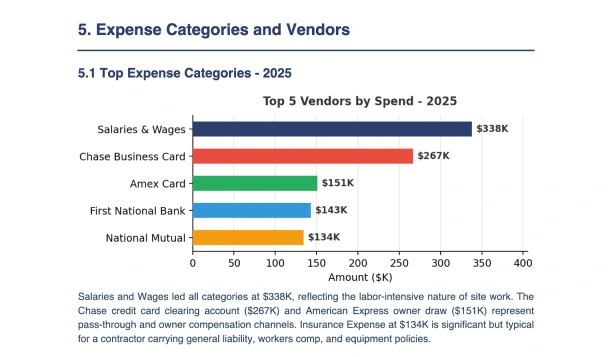
Most small businesses know roughly how much they spend. Very few know precisely where it goes or which vendors are growing the fastest. The expense section fixes that with two lenses: top vendors by spend and expense category breakdown.
Expense Categories Deep Dive
Beyond vendors, the report maps spending across categories like Payroll, Software, Equipment, Travel, and Professional Services. Payroll typically dominates for service businesses (as it did here with Salaries & Wages at $338K), but the report highlights where secondary categories are growing faster than revenue, a key risk signal.
Why this matters for bookkeeping: Accurate, categorised expenses are the foundation of tax compliance and financial planning. LayerNext auto-categorises every transaction so this section isn't just insightful; it means your books are clean and audit-ready.
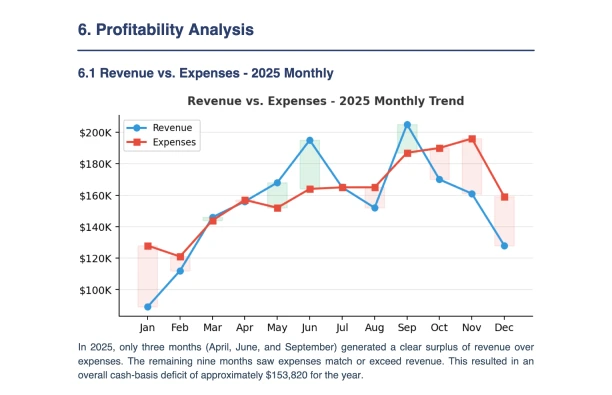
Profitability Analysis: The Real Bottom Line
Revenue is vanity, profit is sanity. The profitability section closes the loop between what is coming in and what is going out, showing monthly net income, full-year P&L projections, and trend analysis.
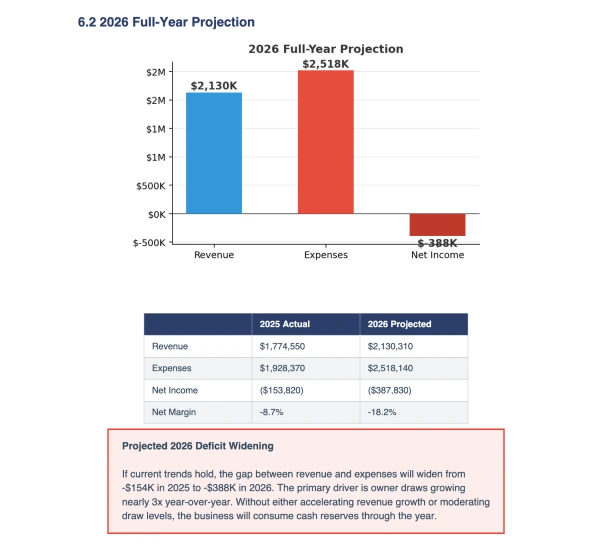
For BondvilleNorth, the 12-month P&L trend revealed that while revenue is growing at 20.1%, expenses are growing 34.7% faster, creating an accelerating cash deficit. In 2025, only three months generated a surplus (April, June, and September), with the remaining nine months seeing expenses match or exceed revenue.
This section is particularly valuable for businesses preparing for fundraising, loan applications, or annual planning because it gives you a forward-looking financial narrative backed by real data, not gut feel.
Data Integrity Check: Trust Every Number Before You Act On It
Before any analysis is worth anything, the underlying data has to be clean. LayerNext's report includes an automated data integrity check that scans for anomalies, missing categorizations, duplicate transactions, and reconciliation gaps.
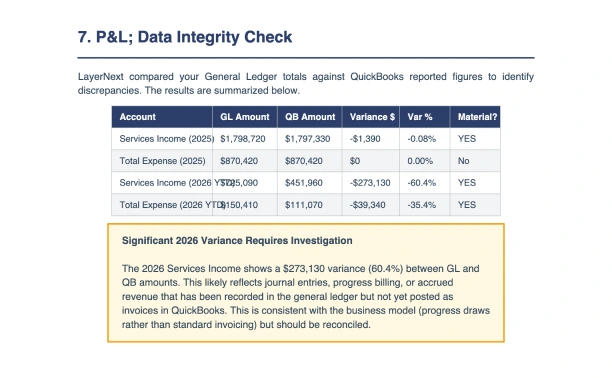
For a business owner, this is the equivalent of a pre-flight checklist. You know your financial data is sound before you make any decision based on it.
See It in Action
Watch how the LayerNext CFO Financial Intelligence Report is generated and what it looks like for your business.
Frequently Asked Questions


26-02-2026-thumb.webp)