.webp)
Summary
The article explains that startup burn rate measures the pace at which a company spends its cash and highlights the difference between gross and net burn. It shows how to calculate net burn and cash runway, recommends aiming for 12–18months of runway, and provides benchmark burn rates for pre‑seed, seed, SeriesA and growth‑stage startups. Founders also learn how burn multiple indicates capital efficiency and how to cut costs without stalling growth—by focusing on unit economics, monitoring burn multiples, and optimizing fixed expenses. The article notes that fractional CFO services can cost thousands per month, but AI‑powered bookkeeping tools like LayerNext deliver real‑time financial insights at a fraction of that cost.
- Burn rate is the amount of cash a business loses per month
- Early-stage startups typically burn $10K to $80K per month
- Growing startups often burn $50K to $200K per month
- Scaling companies may burn $150K to $600K+ per month
- Payroll usually represents 60 to 75 percent of total burn
- Healthy runway is 12 to 18 months
- Burn rate must align with growth stage, not industry
- Burn becomes dangerous when runway drops below 9 months
Introduction
The average burn rate for startups is one of the most searched financial questions among founders and small business operators. Yet the answers online are often incomplete.
Most benchmark discussions focus on venture-backed tech companies. That leaves out a large segment of startups and small to medium businesses that are scaling through revenue, loans, or hybrid funding structures.
Burn rate is not about industry alone. It is about stage, team size, cost structure, and growth ambition.
A software startup, a consulting firm, and a healthcare services company with 12 employees may have nearly identical burn rates despite operating in completely different markets.
This guide provides a stage-based, universally applicable framework to understand:
- What burn rate actually means
- What average burn looks like across startups and SMBs
- How to calculate runway correctly
- When high burn is strategic
- When burn becomes a risk
- How to make informed decisions
The goal is not just to define burn rate. It is to help you control it.
1. What Is Burn Rate?
Burn rate is the amount of cash a business spends each month beyond what it earns.
If expenses exceed revenue, the difference is burn.
Example:
- Monthly expenses: $120,000
- Monthly revenue: $70,000
- Net burn: $50,000
Burn rate determines how long your company can survive before running out of cash.
It is a liquidity metric, not a profitability metric.
2. Gross Burn vs Net Burn
Understanding the distinction matters.
Gross Burn
Gross burn is total monthly operating expenses.
Includes:
- Salaries
- Rent
- Software subscriptions
- Marketing
- Insurance
- Contractors
It does not consider revenue.
Net Burn
Net burn subtracts revenue from expenses.
Formula:
Net Burn = Total Expenses - Total Revenue
Net burn is the number that determines runway.
.webp)
3. Average Burn Rate by Business Stage
Burn rate varies more by stage than by industry.
Stage 1: Founder-Led or Pre-Revenue
Typical burn: $10,000 to $80,000 per month
Profile:
- 1 to 5 people
- Limited salaries
- Minimal marketing
- Product or service development
Primary goal: validation.
Burn depends heavily on founder compensation and outsourcing choices.
Stage 2: Early Revenue and Validation
Typical burn: $40,000 to $200,000 per month
Profile:
- 5 to 20 employees
- Early recurring revenue
- Active marketing spend
- Structured operations emerging
Primary goal: achieving consistent revenue growth.
This is where burn risk increases due to hiring expansion.
Stage 3: Scaling Growth
Typical burn: $150,000 to $600,000+ per month
Profile:
- 20 to 80 employees
- Department-level hiring
- Marketing investment
- Sales infrastructure
Primary goal: accelerating growth.
Burn becomes intentional. The company is spending ahead of revenue.
Stage 4: Expansion-Focused SMBs
Typical temporary burn during growth push: $50,000 to $250,000 per month
Profile:
- Established revenue
- Hiring for expansion
- New location or service line
Unlike early startups, these companies often return to breakeven after expansion stabilizes.
4. What Actually Drives Burn
Industry matters, but these factors matter more:
1. Payroll Structure
Payroll usually accounts for 60 to 75 percent of burn.
Hiring is the primary burn accelerator.
2. Marketing Intensity
Customer acquisition strategy dramatically changes burn:
- Organic growth model: lower burn
- Paid acquisition model: higher burn
3. Fixed vs Variable Costs
High fixed costs increase burn rigidity.
Examples:
- Long-term leases
- Equipment financing
- Enterprise software contracts
4. Revenue Stability
Unpredictable revenue increases net burn volatility.
Recurring revenue businesses often manage burn more predictably.
5. Growth Ambition
Aggressive growth strategies intentionally increase burn.
Burn is not always a mistake. It can be strategic.
5. How to Calculate Burn Rate and Runway
Step 1: Calculate Monthly Net Burn
Example:
- Expenses: $180,000
- Revenue: $120,000
Net Burn = $180,000 - $120,000 = $60,000
Step 2: Calculate Runway
Formula :
Runway = Cash on Hand / Net Burn
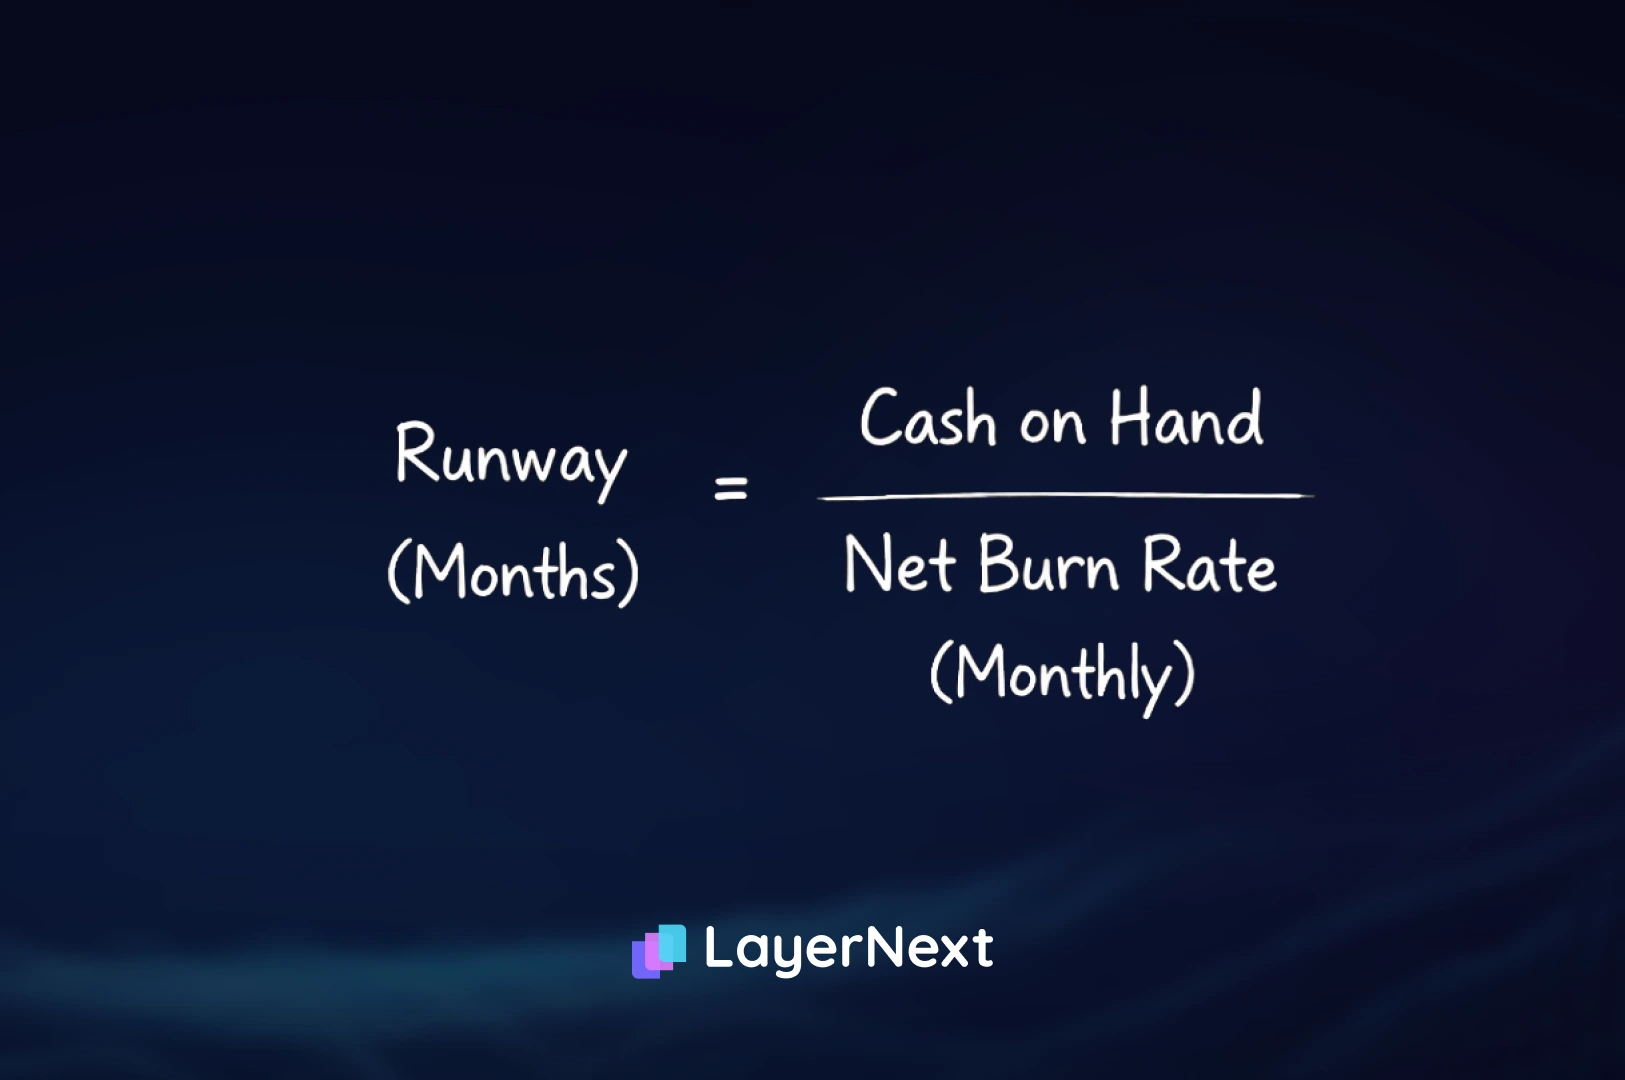
Example:
- Cash available: $900,000
- Net burn: $60,000
Runway = $900,000/ $60,000 = 15 Months
Healthy runway benchmark: 12 to 18 months.
6. Burn Rate vs Runway: What’s the Difference?
These terms are often confused but measure different things:
Burn Rate
Definition: The rate at which you spend cash monthly
Measured in: Dollars per month
Example: $80,000 per month
What it tells you: How fast you’re consuming resources
Runway
Definition: How long your cash will last at current burn rate
Measured in: Months
Example: 14 months
What it tells you: Time until you run out of money
The Relationship
Burn rate and runway are inversely related:
Lower burn rate leads to Longer runway (at same cash level)
Higher cash balance leads to Longer runway (at same burn rate)
Why Both Matter
Burn rate helps you:
Identify where cash is going
Benchmark against similar companies
Find areas to optimize spending
Runway helps you:
Plan fundraising timeline
Make strategic hiring decisions
Assess survival risk
Key insight: You can extend runway by either reducing burn rate OR raising more capital. Most startups need to do both strategically.
7. A Practical Burn Evaluation Framework
Use this 5-part framework to evaluate whether your burn is appropriate.
1. Runway Check
Is runway above 12 months?
If below 9 months, risk increases significantly.
2. Revenue Efficiency
Calculate:
Burn Multiple = Net Burn / Net New Revenue
- Below 1.5: efficient
- 1.5 to 2.5: moderate
- Above 3: inefficient
3. Hiring Discipline
Is headcount growth exceeding revenue growth?
Over-hiring is the most common burn misstep.
4. Scenario Modeling
Model cash flow under:
- Revenue slowdown
- Marketing underperformance
- Delayed payments
Burn should be stress-tested.
5. Funding Timeline Alignment
Are you planning to raise capital with at least 9 months of runway remaining?
Late fundraising increases dilution risk.
7. Comparison by Stage
Note: Runway targets increase at scaling stage because fundraising takes longer and requires more lead time.
Stage alignment is more important than industry comparison.
8. Is My Burn Rate Too High? 5 Warning Signs
Here are the critical red flags that your burn rate has become dangerous:
Warning Sign #1: Runway Below 9 Months Without Committed Funding
Why it matters: Fundraising typically takes 6-9 months from first contact to closed round. If you’re below 9 months and haven’t started raising, you’re in the danger zone.
Action needed: Immediately begin fundraising OR implement cost reductions to extend runway to 12+ months.
Warning Sign #2: Burn Multiple Above 3x
Why it matters: This means you’re spending $3+ for every $1 of new revenue. Unless you’re in a land-grab market, this is unsustainable.
Calculation: If you add $50K in new monthly recurring revenue but burn $180K, your burn multiple is 3.6x.
Action needed: Analyze unit economics. Either improve revenue efficiency or reduce marketing/sales spend.
Warning Sign #3: Headcount Growing Faster Than Revenue
Why it matters: People are your largest expense. If revenue growth is 20% but headcount is growing 40%, burn will accelerate dangerously.
Red flag example: You had 15 people at $500K ARR. Now you have 25 people at $700K ARR. Headcount grew 67% while revenue grew 40%.
Action needed: Freeze non-critical hires. Ensure new hires directly support revenue growth.
Warning Sign #4: Increasing Burn With Flat or Declining Revenue
Why it matters: This indicates fundamental business model issues. You’re spending more to achieve the same or worse results.
Example: Last quarter burn was $120K with $80K revenue. This quarter burn is $150K with $75K revenue.
Action needed: Deep strategic review needed. Something is broken in your growth engine.
Warning Sign #5: No Clear Path to Profitability or Next Funding Round
Why it matters: If you can’t articulate how you’ll become profitable OR how you’ll raise the next round, you’re operating without a viable strategy.
9. When Traditional Advice Fails
Standard advice says “reduce burn.” That is not always correct.
Reducing burn may fail when:
- Market share opportunity is temporary
- Competitors are aggressively funded
- Network effects require scale
- Customer acquisition costs rise over time
In these cases, higher burn can be rational if runway supports it.
The key question is not “Is burn high?”
It is “Is burn aligned with strategy and capital?”
10. How to Reduce Burn Rate Without Killing Growth
Cutting burn doesn’t have to mean killing momentum. Here’s how to reduce expenses strategically:
Strategy #1: Optimize Marketing Spend by Channel
Don’t: Cut all marketing.
Do: Analyze ROI by channel. Double down on high-performing channels, eliminate low performers.
Example: If LinkedIn ads have 8-month CAC payback but Google Ads have 20-month payback, redirect Google budget to LinkedIn.
Strategy #2: Renegotiate Vendor Contracts
Targets:
- Software subscriptions (often 20-40% negotiable, especially for annual commitments)
- Office space (sublease, downsize, or negotiate rent reduction)
- Cloud infrastructure (reserved instances, committed use discounts)
Potential savings: 15-30% of operational costs
Strategy #3: Shift to Fractional or Contract Roles
Approach: Replace full-time hires in non-core functions with fractional executives or contractors.
Examples:
- Fractional CFO instead of full-time finance hire
- Contract recruiter instead of in-house talent team
- Outsourced accounting instead of full-time bookkeeper
Savings: 40-60% cost reduction in these functions
Strategy #4: Implement Hiring Freezes for Non-Revenue Roles
Keep hiring: Sales, customer success, engineering (if product-led growth)
Freeze hiring: Operations, HR, administrative support
Impact: Slows burn growth without stopping revenue growth
Strategy #5: Reduce Office Space or Go Remote
Savings: $500-$1,500 per employee monthly
Considerations: Only works if team is already partially remote and productivity won’t suffer.
Strategy #6: Extend Payment Terms with Vendors
Approach: Negotiate Net 60 or Net 90 terms instead of Net 30.
Impact: Doesn’t reduce burn but extends runway by improving cash flow timing.
Strategy #7: Accelerate Customer Payments
Tactics:
- Offer discount for annual prepayment (10% off for pay-in-full)
- Shorten payment terms from Net 60 to Net 30
- Implement auto-billing for subscriptions
Impact: Improves cash position, reduces net burn if revenue timing improves.
Strategy #8: Cut Low-Impact Benefits, Keep High-Impact Ones
Keep: Health insurance, core productivity tools, professional development that drives revenue skills
Consider cutting: Catered meals, unlimited PTO policies that aren’t used, expensive team offsites, premium office amenities
Strategy #9: Optimize Technical Infrastructure
Actions:
- Move from AWS to reserved instances (30-50% savings)
- Eliminate redundant SaaS tools
- Negotiate enterprise pricing for must-have software
- Use open-source alternatives where appropriate
Example savings: $5K-$20K monthly for typical Series A company
What NOT to Cut
Avoid cutting:
- Customer support quality (drives churn)
- Product development on core features
- Sales compensation for top performers
- Mission-critical security or compliance tools
The key principle: Cut overhead and inefficiency, not growth drivers.
11. How LayerNext Helps With Burn Strategy
Managing burn rate requires structured visibility, not reactive cost cutting.
LayerNext supports startups and small to medium businesses that need clarity around cash flow, forecasting, and capital planning. It is designed for leadership teams navigating growth decisions, hiring plans, and funding timelines.
Rather than focusing only on bookkeeping, LayerNext helps businesses align spending with strategic milestones. Founders gain forward-looking insight into runway sensitivity, burn scenarios, and expansion timing.
It is particularly valuable for:
- Startups preparing for fundraising
- SMBs entering expansion phases
- Companies hiring ahead of demand
- Leadership teams seeking disciplined growth
LayerNext is the right fit when growth is intentional and capital must be managed with precision.
Burn rate strategy is not about minimizing spend. It is about controlling it with intelligence.