Summary
- The accounts payable turnover ratio measures how many times a company pays off its average AP balance in a given period. A higher ratio means faster payment. A lower ratio means slower payment.
- The formula is Total Purchases ÷ Average Accounts Payable. Convert it to days by dividing 365 by the ratio to get days payable outstanding (DPO).
- There is no universal "good" ratio. A range of 6 to 12 covers the middle of most industries, but what matters is how your number compares to your vendor payment terms and your working capital strategy.
- A high ratio is not automatically a strength. Paying faster than your terms require leaves usable cash on the table, unless an early payment discount justifies it.
- A low ratio is not automatically a problem. Paying at the end of agreed terms is a legitimate cash management strategy, as long as you are not paying late.
- Industry sets the baseline. Retail and technology companies typically run higher ratios (8 to 18). Manufacturing, construction, and healthcare companies typically run lower (5 to 12).
- The most common causes of an unintentionally low ratio are invoice processing delays, approval bottlenecks, and high exception volume. All three are fixable with AP automation.
Most companies calculate their accounts payable turnover ratio and immediately ask the wrong question. They want to know if the number is high enough, when the more useful question is whether it's right for their business given their vendor terms, cash position, and working capital goals.
This article explains what the AP turnover ratio measures, how to calculate it, what the benchmarks actually look like by industry, and how to interpret a number that is trending in either direction. Whether you are a CFO evaluating your AP function or a business owner trying to make sense of a metric your accountant flagged, the goal here is context, not just a formula.
What Is the Accounts Payable Turnover Ratio?
The accounts payable turnover ratio measures how many times a company pays off its average accounts payable balance over a given period, usually a fiscal year or quarter. It reflects the pace at which a business settles its obligations to suppliers and vendors.
This is a liquidity efficiency metric, not a profitability one. It tells you how a company manages short-term obligations, not whether it is making money. A high ratio means you are paying suppliers quickly. A low ratio means you are taking longer. Neither direction is good or bad on its own.
It is closely related to days payable outstanding (DPO), which expresses the same idea in days rather than turns. Many CFOs and controllers find DPO easier to use in operational conversations because it maps directly to payment terms.
The AP Turnover Ratio Formula
Where:
- Total Purchases is the value of goods and services purchased on credit during the period. Some analysts substitute cost of goods sold (COGS) when purchase data is not readily available, though total purchases is the more precise input for this metric.
- Average Accounts Payable is calculated as (Beginning AP + Ending AP) ÷ 2.
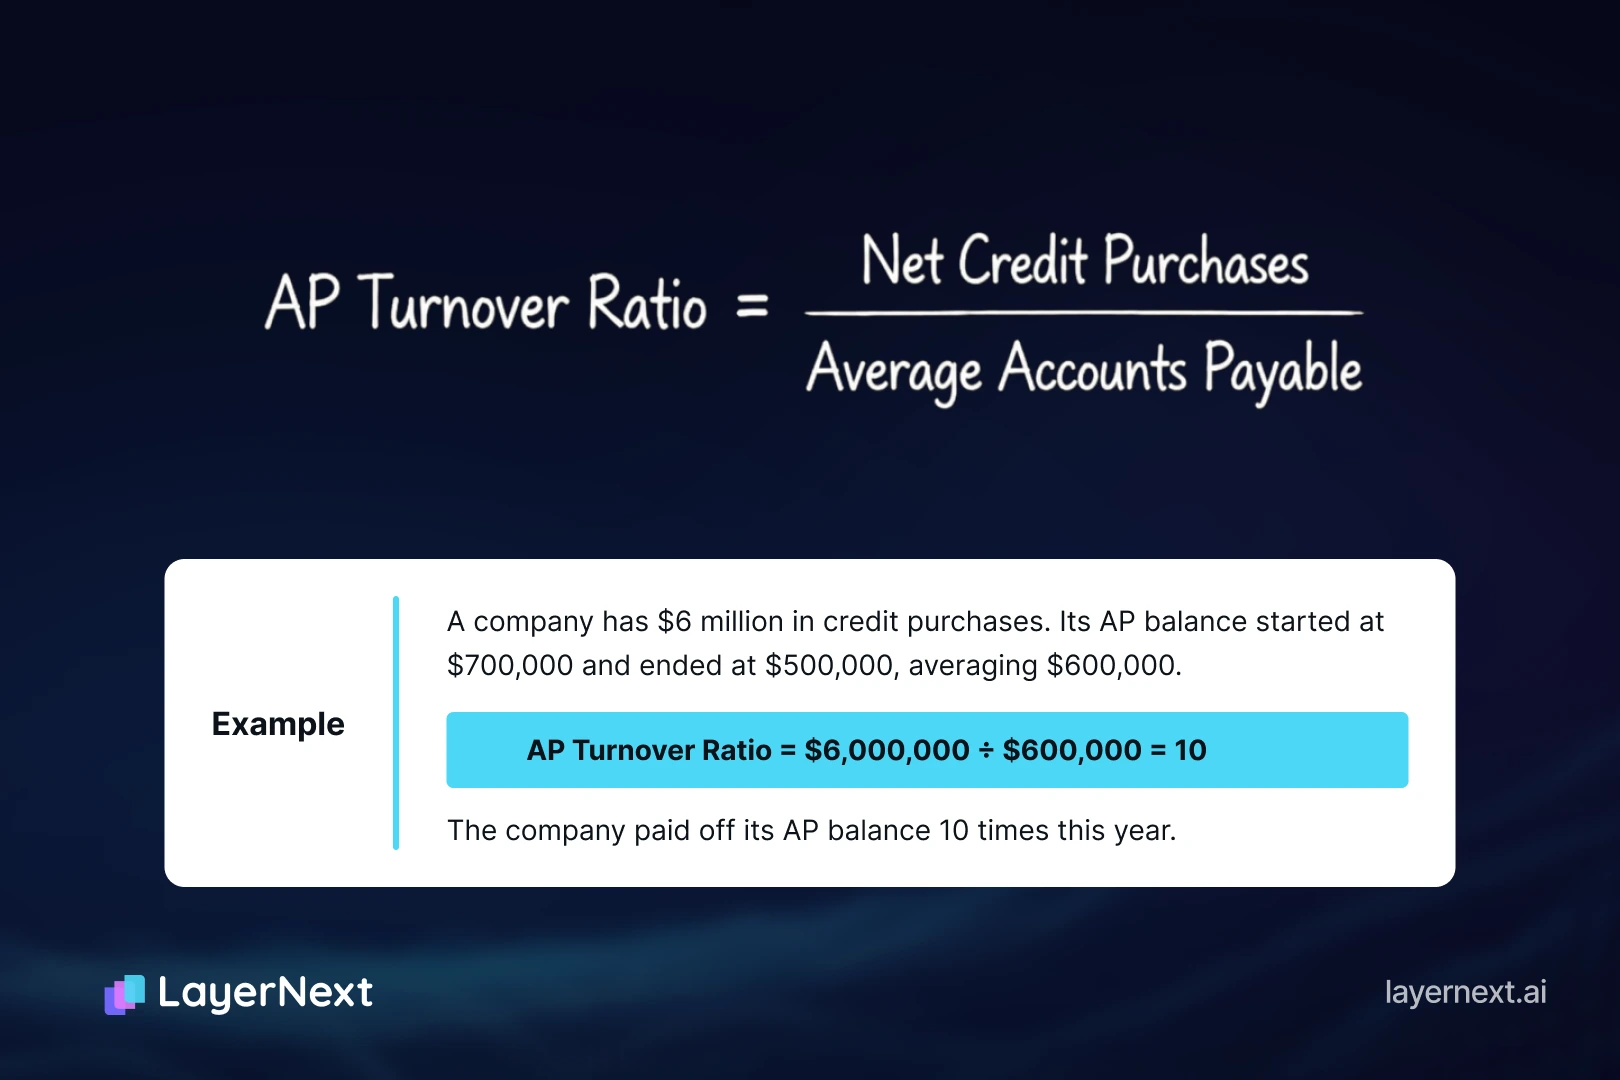
Example
A manufacturing company has $6 million in credit purchases over the year. Its beginning AP balance was $700,000 and its ending AP balance was $500,000, giving an average AP of $600,000.
AP Turnover Ratio = $6,000,000 ÷ $600,000 = 10
The company paid off its average AP balance 10 times during the year.
One note on the COGS substitution: it understates purchases for businesses with significant inventory build or where supplier payments include non-COGS items like services and overhead. Use total purchases whenever your accounting system can produce it cleanly.
How to Convert AP Turnover to Days Payable Outstanding (DPO)
To convert the ratio to days:
DPO = 365 ÷ AP Turnover Ratio
Using the example above: 365 ÷ 10 = 36.5 days
DPO is easier to compare against your vendor payment terms. If your average vendor terms are net-45 and your DPO is 36 days, you are paying roughly nine days earlier than required. That is a working capital conversation worth having.
Accounts Payable Turnover Ratio Calculator
To find your own number, pull three figures from your financials: total credit purchases for the period, your beginning AP balance, and your ending AP balance. Average the two balances, then divide total purchases by that average. For a quick read on payment pace, divide 365 by the result to convert the ratio into days. Add your average vendor terms and the calculator below will tell you whether you are paying ahead of, behind, or in line with those terms. If you run the calculation each quarter, the trend will tell you more than any single figure.
What Is a Good AP Turnover Ratio?
There is no universal "good" number. Articles that cite 6 to 12 as the target range are giving you a statistical center of mass, not a benchmark with meaning for your specific business.
Three factors determine what is actually healthy for your company:
- Your industry.
Manufacturing and retail businesses carry large volumes of purchased goods and often negotiate 30- to 90-day terms with suppliers. Service businesses have lighter AP loads and may pay faster by default. Comparing a software company's AP turnover to a construction firm's ratio tells you nothing useful. - Your negotiated vendor terms.
The only meaningful benchmark for your AP turnover ratio is your own payment terms. If your average vendor terms are net-60 and your DPO is 30 days, you are paying twice as fast as required. That is not a sign of financial health; it is a cash flow decision worth examining. - Your working capital strategy.
Companies in a cash conservation mode will deliberately extend payment cycles. Companies with excess liquidity or access to early payment discounts may pay faster. Neither choice is wrong; both should be deliberate.
AP Turnover Ratio Benchmarks by Industry
The following ranges reflect typical AP turnover ratios across major sectors. These are reference points based on publicly reported financial data and industry analysis, not hard rules.
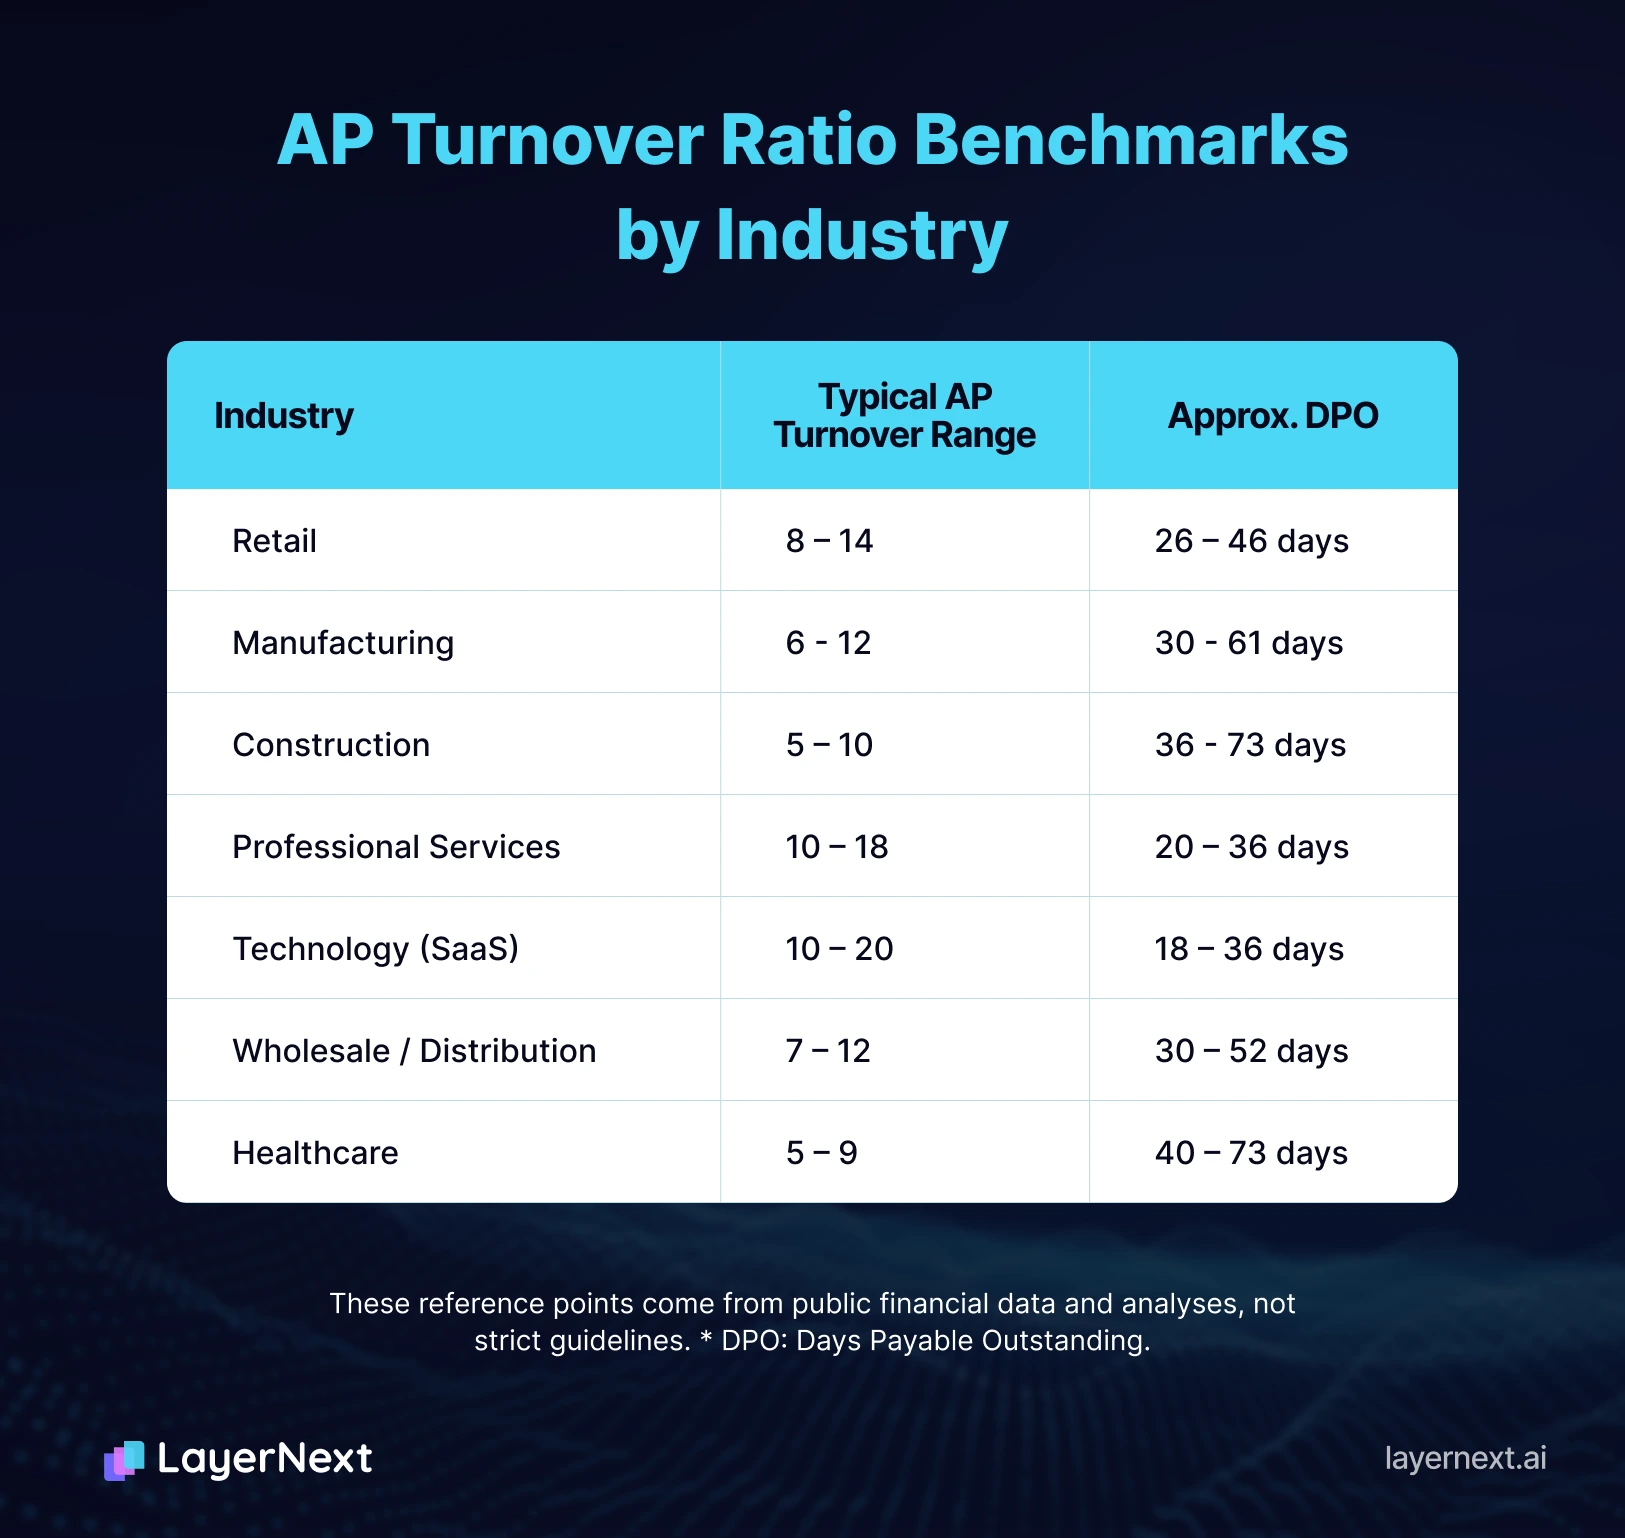
The variance within each industry is wide. A large-scale retailer negotiating net-60 terms with major suppliers will have a lower ratio than a small retailer paying net-30. Industry averages are a starting point for context, not a target to optimize toward.
High vs. Low AP Turnover: What Each Signals
A high AP turnover ratio (roughly 10 and above) means the company is paying vendors quickly relative to its purchase volume. This can reflect strong liquidity, a disciplined payment culture, or vendors that require shorter terms. It can also mean the company is paying faster than its terms require, which has an opportunity cost.
A low AP turnover ratio (roughly 5 and below) means the company is taking longer to pay. This may be deliberate, as in a company strategically holding cash longer within its terms. It may also indicate cash flow stress, a high volume of disputed invoices, or process delays in the AP function itself. The distinction matters, and the ratio alone does not tell you which one you are looking at.
In both cases, the trend over time is more informative than any single period's ratio. A ratio declining steadily across four quarters points to something different than a one-time dip caused by a seasonal cash position.
Why a High AP Turnover Ratio Is Not Always Better
Paying suppliers faster than your terms require is, in most cases, an interest-free loan to your vendors. If your supplier offers net-60 terms and you are paying in net-20, you are holding 40 days of cash on their behalf with no return.
Consider the opportunity cost. That cash could be applied to:
- Reducing a revolving credit line carrying 7 to 9% interest
- Short-term instruments earning a modest but real yield
- Operating expenses in a growth phase where capital is constrained
The exception is when early payment earns a discount that exceeds your cost of capital. A common early payment discount is 2/10 net 30, meaning you receive a 2% discount by paying within 10 days instead of 30. Annualized, a 2% discount on 20 days of float is equivalent to roughly 36% annually. If your cost of capital is below that and it almost certainly is early payment makes financial sense.
Outside of scenarios with meaningful early payment discounts, paying faster than required is a working capital cost, not a virtue. A CFO who reviews AP turnover without reference to vendor terms is missing half the picture.
Why a Low AP Turnover Ratio Is Not Always Bad
A lower ratio, meaning slower payment, can be a deliberate and rational cash management strategy. Businesses managing seasonal cash cycles, funding a product launch, or carrying high-interest debt often benefit from extending payment cycles to the maximum allowed under their vendor agreements.
The critical distinction is between strategic slow payment and problematic slow payment.
The difference shows up in vendor relationships. Suppliers that are paid consistently within terms, even if at the tail end of the allowed window, typically maintain their pricing, credit limits, and supply priority. Suppliers that experience late payments or unpredictable payment schedules respond by tightening terms, requiring deposits, or shifting to cash on delivery. In industries with concentrated supplier bases, that risk is material.
A low ratio that sits comfortably within vendor terms is a treasury decision. A low ratio that reflects invoices aging past due is an operational problem.
How to Improve Your AP Turnover Ratio
What "improve" means depends on which direction you are trying to move, and why.
If you want to increase your AP turnover ratio (pay more consistently and on time)
The most common root causes of a lower-than-intended ratio are invoice processing delays, approval bottlenecks, and exception volume. Fixes that move the number:
Automate invoice capture and matching.
Manual invoice entry introduces errors that delay approval. When invoices are automatically captured, parsed, and matched against purchase orders and receipts, the time from receipt to payment authorization drops significantly. Platforms like LayerNext automate this across every channel invoices arrive through, whether email, shared folders, accounting software, or cloud storage, with no coding required to configure the workflow.
Apply vendor-specific processing rules.
Different suppliers have different invoicing formats, tax requirements, and approval thresholds. When those rules have to be looked up manually, or when exceptions require back-and-forth with the AP team, approval cycles stretch. LayerNext's Business Rules engine lets finance teams define supplier-specific processing logic in plain English, no development work required. Those rules are applied automatically at processing time, reducing the manual handling that slows payment cycles. And because the rules can be managed by the internal team directly, they stay current as vendor agreements change.
Resolve disputes earlier in the cycle.
Most late payments trace back to an invoice that is sitting in a dispute queue. Catching discrepancies at the point of receipt, before an invoice enters the approval workflow, reduces the backlog significantly.
Work with legacy systems.
A common obstacle to AP automation is that the accounting or ERP system in use does not have API connectivity. LayerNext addresses this directly: its computer use agent can operate legacy desktop applications through their own user interface, meaning automation does not require an ERP upgrade or a new integration project.
If you want to strategically lower your AP turnover ratio (extend payment cycles)
Negotiate longer terms with key vendors.
Net-30 is a default, not a fixed rule for most supplier relationships. Vendors that value predictable, on-time payment are often willing to extend terms to net-45 or net-60 for established customers. The negotiation is easier when you have a clean payment history.
Use dynamic discounting or supply chain finance.
Supply chain finance programs allow suppliers to receive early payment through a third-party funder, while the buyer maintains its extended payment cycle. Both parties benefit; the buyer preserves cash, the supplier gets faster access to funds.
Align payment runs with your cash conversion cycle.
If your receivables collect on a 45-day cycle, structuring payables to clear at day 40 to 50 keeps working capital positive without straining supplier relationships.
AP Turnover Ratio vs. Days Payable Outstanding: Which Should You Track?
Both metrics measure the same underlying thing from different angles. AP turnover ratio is expressed as a multiple (how many times per year you pay off your AP balance). DPO is expressed in days (how long, on average, it takes you to pay a supplier invoice).
CFOs and controllers tend to prefer DPO for day-to-day AP management because it maps directly against vendor terms. It is easier to say "our DPO is 42 days against average terms of 45 days" than to explain what a ratio of 8.7 means in a team meeting.
Investors and financial analysts tend to use the turnover ratio because it is easier to compare across companies and periods in a standardized format.
The practical answer is to track both. Use DPO operationally to monitor payment performance against terms. Use the turnover ratio for period-over-period trend analysis and external benchmarking.
Stop Guessing at Your AP Ratio: Start Managing It
If your accounts payable turnover ratio is not where you want it, the root cause is almost always one of three things: invoices processing too slowly, too many exceptions requiring manual handling, or payment cycles that were never deliberately designed.
LayerNext automates the AP workflow from end to end invoice capture from any source, supplier-specific processing rules set in plain English, approval routing, and payment execution without requiring a coding team or an ERP replacement. It works with the systems you already have, including legacy desktop applications that have no API.
Finance teams that use LayerNext reduce invoice processing time, cut exception volume, and gain full visibility into AP status through a single management dashboard. The result is an AP function that runs on schedule, not behind it.
Frequently Asked Questions