Summary
How to forecast accounts payable starts with one number: days payable outstanding, or DPO. Get that number wrong, or build it on AP data your team doesn't fully trust, and the forecast is wrong before the first formula runs.
This article covers:
- The DPO formula, plus the separate formula that turns DPO into a forward forecast
- Two other forecasting methods, and when each fits better than DPO
- Why AP forecasts break before anyone opens a spreadsheet
- How to keep the forecast current without rebuilding it by hand every month
Why accounts payable is harder to forecast than it looks
Accounts payable looks predictable on paper: known vendors, known terms, known invoice amounts. In practice, the gap between when an invoice arrives and when cash actually leaves the business is where forecasts go wrong. Approval delays, disputed line items, and inconsistent data entry all shift real payment dates away from stated terms.
The timing gap between invoice and payment
Net 30 terms don't mean payment on day 30. They mean payment is due no later than day 30, and what actually happens depends on when the invoice was logged, who has to approve it, and how many people are in that approval chain. A $40,000 equipment invoice that sits in an approval queue for nine days before reaching the right approver pays nine days later than the terms suggest, and a forecast built only on stated terms misses that gap entirely.
AP is not a peripheral input to cash planning either. 65% of AP teams are now actively involved in their company's cash flow forecasting and financial planning, according to Ardent Partners' AP Metrics That Matter in 2025 report. Forecasting AP accurately is a core AP function now, not a side task handed to FP&A once a quarter.
Why "just look at last quarter" undersells the problem
Averaging last quarter's AP balance and calling it a forecast ignores everything that changes the number: a new supplier on different terms, a seasonal spike in purchasing, a renegotiated payment term, or simple growth in spend. A forecast needs a formula that accounts for what's actually driving the balance, cost of goods sold and payment pace, not just a snapshot of where the balance happened to sit last time.
How to forecast accounts payable using the DPO formula
Days payable outstanding forecasting works in two separate steps. First, calculate historical DPO from actual accounts payable and cost of goods sold data. Second, apply that DPO forward against forecasted COGS to produce a projected AP balance. Most guides on this topic show only the first step and leave the second implicit, which is where a lot of confusion starts.
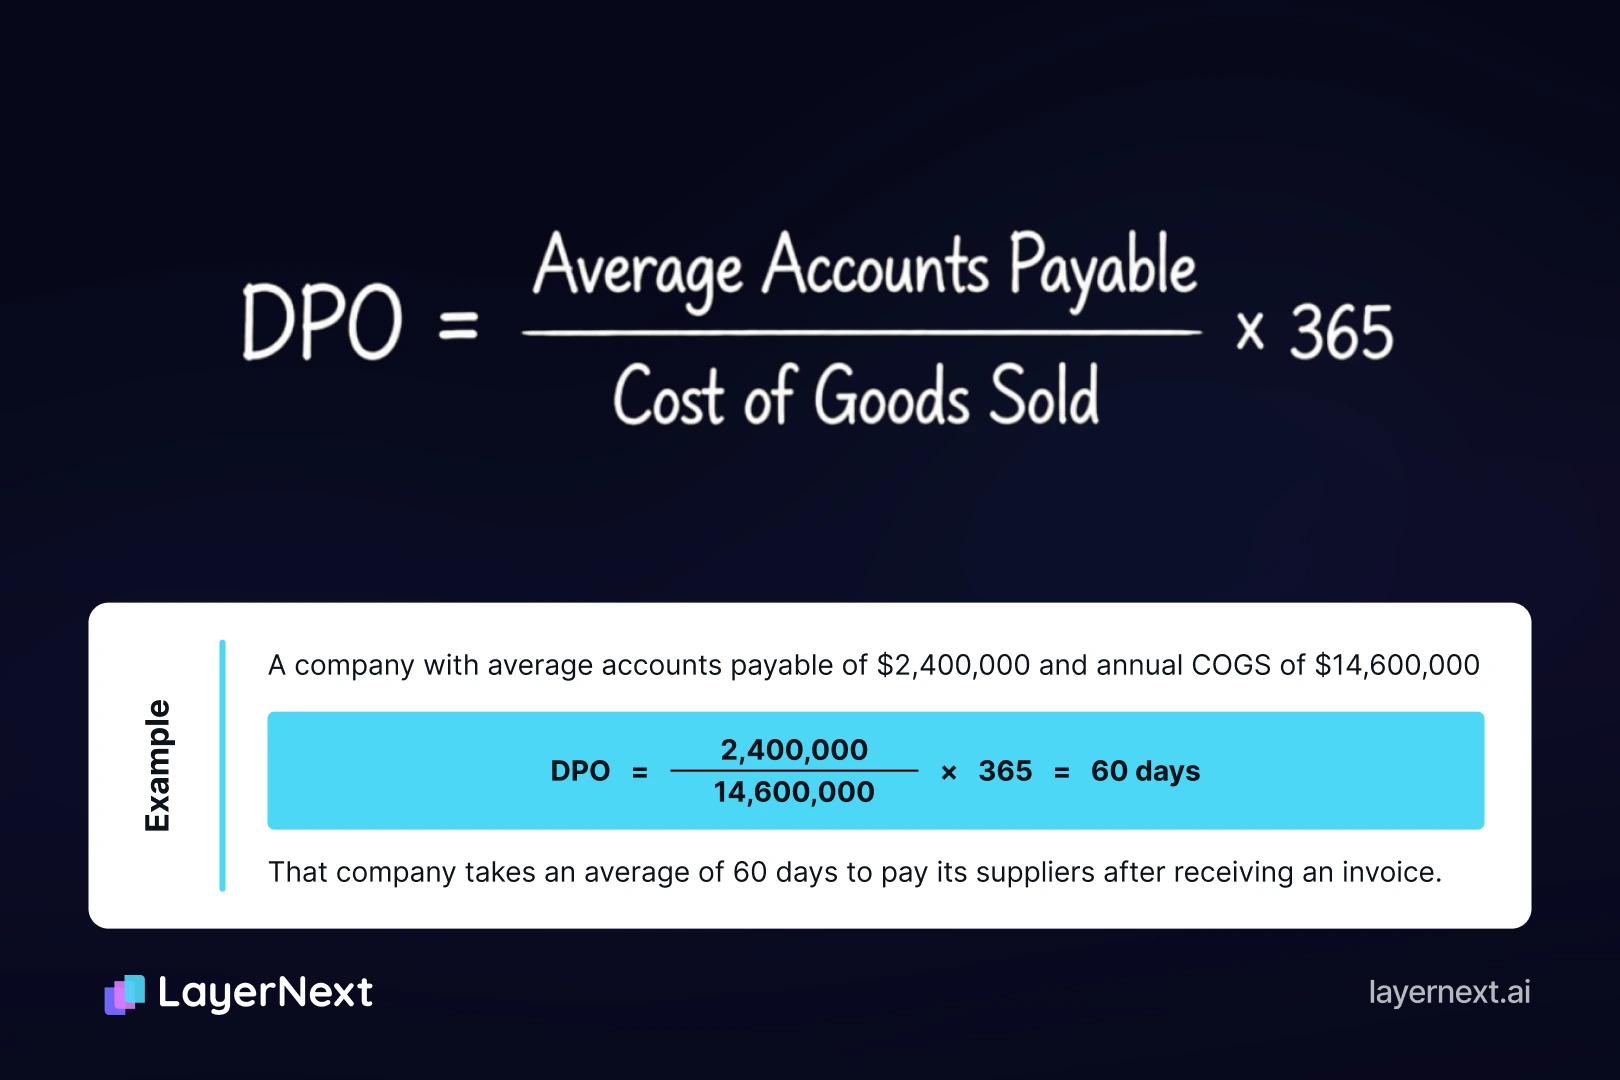
Step 1: Calculate your historical DPO
The formula:
DPO = (Average Accounts Payable ÷ Cost of Goods Sold) × 365
Average accounts payable is your beginning AP balance plus your ending AP balance for the period, divided by two. COGS comes from the income statement for the same period. Using 365 days assumes an annual period; use the actual day count if you're calculating for a quarter or month instead, and make sure COGS covers that same window, not a full year's figure applied to a partial period.
Step 2: Apply DPO forward to forecast AP
Calculating DPO tells you what already happened. Forecasting AP means using that number to project what's coming. The formula:
Forecasted AP = (DPO × Forecasted COGS) ÷ 365
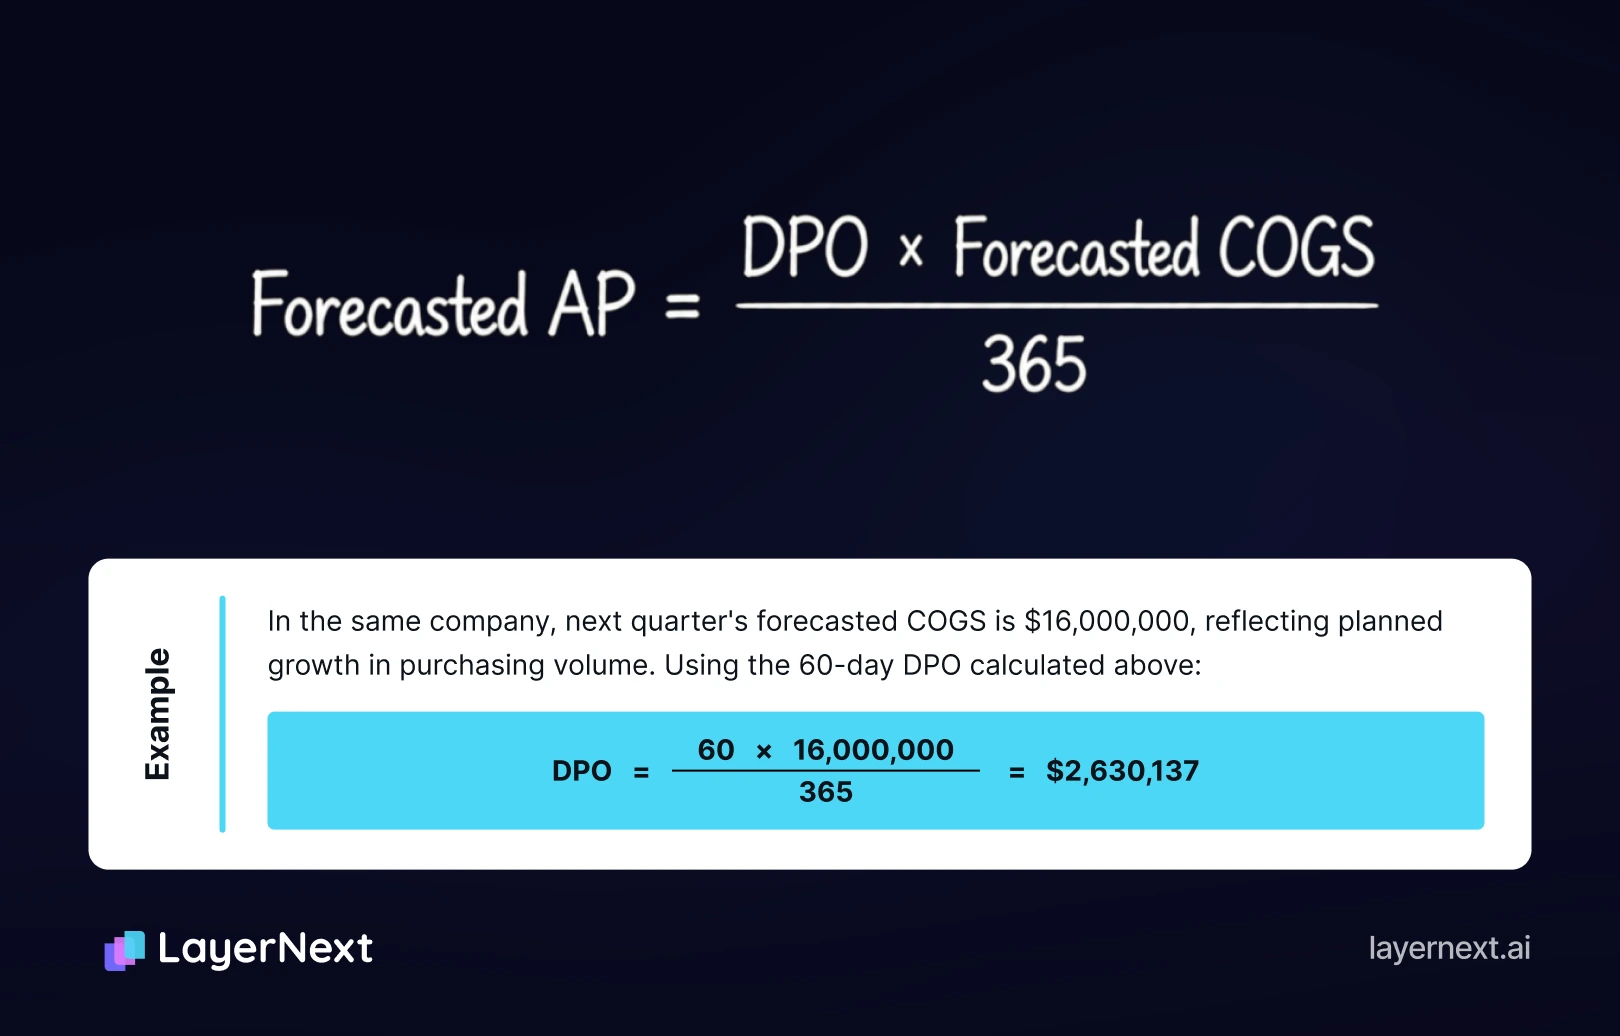
That's the projected AP balance if the company keeps paying suppliers at the same 60-day pace while COGS grows. If the pace changes, because terms shift or the company decides to pay faster or slower, the DPO assumption in this formula needs to change with it.
Two other methods worth knowing, and when to use them instead
DPO forecasting is not the only method, and it is not always the right one. The percent-of-purchases method works faster for businesses with stable, predictable spend. A short-term rolling view, built around the next 13 weeks, answers a different question: not what AP will look like next quarter, but which specific payments are due next Tuesday.
The percent-of-purchases method, for stable, predictable spend
If a business's purchasing pattern and payment behavior are both consistent, a simpler formula gets close enough without the DPO calculation:
Forecasted AP = Forecasted Purchases × Historical AP%
Historical AP% is the share of a typical period's purchases that remain unpaid at period end, based on past data. Worked example: a company expects $5,000,000 in purchases next quarter, and historically 18% of purchases remain unpaid at the end of a period:
Forecasted AP = 5,000,000 × 0.18 = $900,000
This method breaks down fastest for seasonal businesses or anyone with irregular purchasing volume, since it assumes the historical percentage holds steady.
The short-term rolling view, for the next 13 weeks of cash planning
DPO and percent-of-purchases both answer a strategic question: what will the AP balance look like at a future point in time. A 13-week rolling forecast answers an operational one: which invoices are actually due, week by week, over roughly the next quarter. It's built from real invoice due dates, approval status, and scheduled payment runs rather than an average, and it's the tool for answering "can we cover payroll and vendor payments this specific week," not "what will our AP balance be in Q3." Treasury and AP teams typically run both: DPO for the budget and board reporting, the 13-week view for the actual weekly disbursement plan.
Why the forecast breaks before you ever open a spreadsheet
A DPO forecast is only as accurate as the AP ledger feeding it. Industry-wide, the average invoice exception rate sits at 22%, compared with 9% at top-performing AP teams, according to Ardent Partners. Every one of those exceptions is a payment whose timing and amount the forecast has to guess at instead of know.
Invoice data scattered across email, shared drives, and disconnected ERPs
Enterprise AP data rarely lives in one place. Some invoices arrive by email, some sit in a shared folder, some come through an ERP that's fifteen years old and was never built with a public API. A controller running that older ERP has two realistic options: pay an IT team to build custom middleware, or accept that a chunk of AP data stays outside the forecast entirely.
LayerNext's computer-use agent addresses the second case directly. It operates inside the ERP's own interface the same way a person would, so a system with no API still feeds the forecast, without a middleware project. The same platform pulls invoices from a dedicated AP inbox, shared folders, cloud storage such as AWS S3 or Google Cloud, and connected SQL databases, so the forecast isn't missing whatever channel a given vendor happens to use.
Exceptions handled inconsistently, supplier by supplier
Different suppliers need different handling. One vendor's invoices need a tax check against the shipping province, another's need a purchase-order tolerance of 2%, a third gets paid on delivery confirmation instead of invoice date. Without documented rules, different AP staff resolve the same exception differently, and that inconsistency corrupts the historical AP data that DPO gets calculated from.
LayerNext's business rules section lets a finance team write and edit these exceptions in plain English, per entity, without involving IT. If one supplier's invoices need a different check than everyone else's, that rule gets written once and applied the same way every time. The rule lookup is built to stay accurate even at a few thousand rules, searchable by supplier name, so exception handling doesn't degrade as the vendor list grows.
How do you turn this into a forecast you don't have to rebuild every month?
Comparing forecasted AP against actual AP after each close is the fastest way to catch a forecast drifting off track. Beyond that comparison, the more durable fix is making the forecast itself recurring, so it updates on a set cadence instead of depending on someone remembering to rebuild it.
Comparing forecast to actual and catching drift early
After each month or quarter closes, compare the forecasted AP balance to the actual one. Note the direction and size of the miss, then adjust the DPO assumption for the next cycle rather than carrying the same number forward indefinitely. A useful outside reference point: APQC's benchmarking research puts median DPO at around 40 days across industries, with organizations in the 75th percentile closer to 50 days. Treat that as a general anchor, not a target. The number that matters most is your own trailing DPO, tracked consistently over time.
Making it recurring instead of a manual fire drill
This is also where the forecast stops being a manual monthly task. Inside LayerNext's enterprise chat portal, a finance team member can ask directly for the current accounts payable forecast, using the same DPO calculation described above, and set it to run automatically on a recurring cadence, monthly for example. Any invoice that needs a human decision along the way becomes a task in the portal, searchable by invoice number, so the forecast isn't waiting on an exception nobody has looked at yet.
FAQ